Data intelligence

Data

Intelligence

Our Data Intelligence solution helps brands move from scattered data to confident action. We connect market research, dashboarding, SQL-based reporting logic, and ETL design into one decision-making layer so leaders can see where growth is happening and where attention is needed next.

Market research & opportunity studies

Scoping where your market is
moving

Tableau dashboards & scorecards

Executive & operational
reporting

SQL-based reporting structures

Metric logic, segmentation &
definitions

ETL and data-flow design

Cleanliness, consistency &
reliability

WHY IT MATTERS

Decision-grade visibility for growth, operations and

leadership

Most companies have more data than they can use, but less clarity than they need. Reports live in different tools, teams use different definitions, and insights arrive too late. We solve that by designing data systems that make performance visible, understandable, and actionable.

Ideal for

WHAT WE DELIVER

Everything needed to turn data into
confident decisions

Market research, competitor analysis, and opportunity mapping

Understanding the landscape before building your reporting strategy

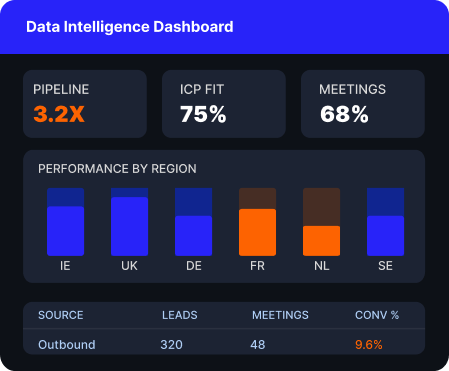
Tableau dashboard design for executive and operational reporting

Visual, role-specific dashboards that surface the right metrics for the right audience

SQL-ready metric logic, segmentation rules, and reporting definitions

A shared data language that eliminates misalignment across teams

ETL planning to improve data cleanliness, consistency, and reporting reliability

Clean data pipelines from source to dashboard, with no silent failures

Benchmarking, KPI scorecards, and performance trend analysis

Context and comparison so your numbers tell a story, not just a snapshot

Ongoing insight reviews and optimisation recommendations

Regular review cycles to refine definitions, add metrics, and act on what the data reveals

HOW IT HELPS

One source of truth for every team

Creates a single source of truth across
marketing, sales, and operations

Improves territory planning and expansion
decisions with evidence

Supports leadership conversations with
more confidence and fewer assumptions

Makes decision-making faster through
cleaner reporting and cleaner metrics

Reduces manual reporting effort and
interpretation conflicts between teams

BEST-PRACTICE APPROACH

Built to explain, not just
display

Detailed data pages should not read like technical manuals. They should explain why visibility matters to commercial decisions, then show the framework behind the dashboards and research. That is how this page is structured — so that a non-technical buyer understands the value before they see the mechanics, and a technical buyer can validate the methodology quickly.

THE PROGRAMME

Stages of a data intelligence

engagement

01

DISCOVERY

Discovery and reporting audit

We review current data sources, reporting gaps, stakeholders, KPIs, and recurring decisions that need better information to be made reliably.

02

ARCHITECTURE

Data model and KPI design

We define the logic behind metrics, joins, segment rules, and dashboard structure so reporting reflects the business accurately and consistently.

03

BUILD

Dashboard and insight build

We create Tableau dashboards, benchmarking views, and performance scorecards for leaders and operational teams — designed for clarity, not complexity.

04

INTEGRATION

ETL and reporting enablement

We design cleaner data flows and train teams on how to use the reporting layer in real decision-making so insights drive action, not just reviews.

01

OPTIMISATION

Optimisation and insight loop

We turn data into action through recurring insight reviews, trend analysis, and recommended improvements — so the system stays aligned with business change rather than becoming stale.

KPI FRAMEWORK

The metrics we track across

every engagement

Visibility

Reporting timeliness, dashboard adoption rate, stakeholder trust in the data layer, and reduction in manual report requests

Performance

Conversion trends, CPA trends, revenue by area, and pipeline created — tracked consistently across reporting cycles

Territory

Productivity by region, reach, heatmap coverage, and opportunity density by segment and geography

Operations

Activity leads, QA signals, rep variance, funnel bottlenecks, and pipeline hygiene scored across teams and time periods

LET’S GET STARTED

Need visibility you can actually use?

We build the research, dashboard, and reporting foundation that makes commercial
decisions easier and faster — from the first conversation to ongoing optimisation.