
Market analysis · Ireland · CSO Census 2022
Doors, not people: the real shape of door-to-door demand in Ireland
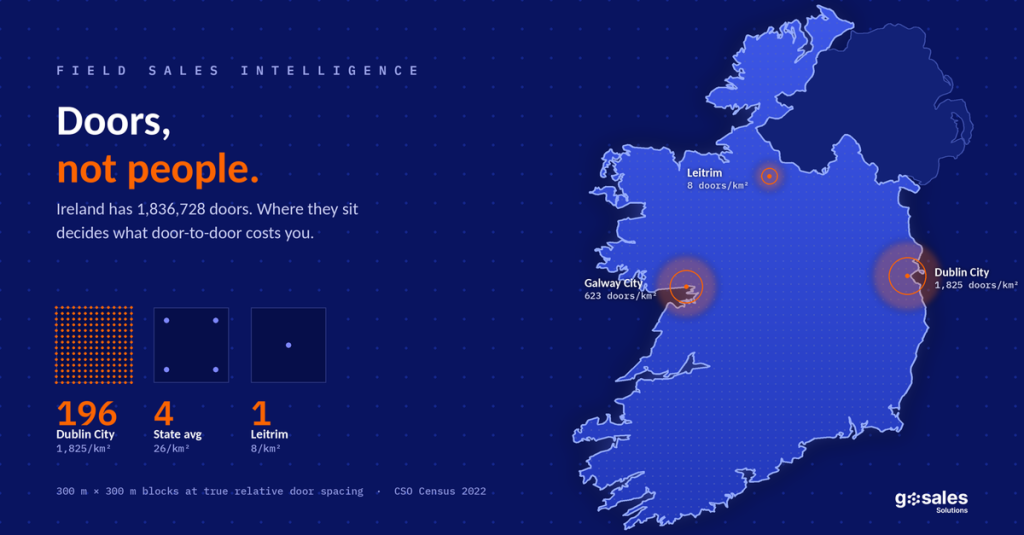
Every field sales plan we are asked to review is built on population. Population is the wrong unit. The unit that decides cost per acquisition is the number of occupied private households a rep can reach on foot in a day — and across Ireland’s 31 local authority areas that number varies by a factor of 230.
01 · The unit problem
Population tells you the size of the prize. It tells you nothing about the cost of collecting it.
Ireland had 5,149,139 people on census night 2022 and 1,836,728 occupied private households. A door-to-door campaign cannot sell to a person. It sells to a household, through a door, at a location. So the planning unit is the door, and the constraint is how far apart the doors are.
We define the metric as doors per square kilometre: occupied private households divided by area. Because CSO publishes population density directly, the same figure can be derived as density × 0.98 ÷ average household size, where 0.98 is the share of the population living in private households nationally (5,046,681 of 5,149,139) and household size is the county average. Average household size is 2.74 nationally, but it ranges from 2.48 in Dublin City to 3.02 in Fingal and Meath — a 22 per cent swing that quietly moves door counts in the opposite direction to population in the commuter belt.
Dublin City has roughly 1,825 doors per km². The state average is 26. Leitrim is 8. That is a 230-fold range inside one small country.
Two counties can have the same population and completely different field economics. Two counties can have the same population density and different door density, because their households are different sizes. Neither of those facts shows up in a plan built on headcount.
02 · The ranking
Ranked: 29 of Ireland’s 31 local authority areas
The last column is the one that changes budgets: the ground a single rep must cover to reach 500 doors, which is roughly one week of urban canvassing.
| Local authority area | Population 2022 | Persons /km² |
Avg HH size | Doors /km² | Avg door spacing |
km² for 500 doors | Density basis |
|---|---|---|---|---|---|---|---|
| Dublin City | 592,713 | 4,618 | 2.48 | 1,825 | 23 m | 0.3 | CSO |
| Dún Laoghaire-Rathdown | 233,860 | 1,848 | 2.71 | 668 | 39 m | 0.7 | CSO |
| Galway City | 83,456 | 1,665 | 2.62 | 623 | 40 m | 0.8 | CSO |
| South Dublin | 301,075 | 1,352 | 2.97 | 446 | 47 m | 1.1 | Indicative |
| Fingal | 330,506 | 725 | 3.02 | 235 | 65 m | 2.1 | Indicative |
| Louth | 139,703 | 169 | 2.80 | 59 | 130 m | 8.4 | Indicative |
| Kildare | 247,774 | 146 | 2.74* | 52 | 138 m | 9.6 | Indicative |
| Meath | 220,826 | 94 | 3.02 | 30 | 181 m | 16.4 | Indicative |
| Wicklow | 155,851 | 77 | 2.84 | 27 | 194 m | 18.8 | Indicative |
| Limerick City and County | 209,536 | 76 | 2.74* | 27 | 192 m | 18.4 | Indicative |
| Waterford City and County | 127,363 | 69 | 2.74* | 25 | 201 m | 20.2 | Indicative |
| Wexford | 163,919 | 69 | 2.74* | 25 | 201 m | 20.2 | Indicative |
| Carlow | 61,968 | 69 | 2.77 | 24 | 202 m | 20.5 | Indicative |
| Laois | 91,877 | 53 | 2.90 | 18 | 236 m | 27.9 | Indicative |
| Westmeath | 96,221 | 53 | 2.74* | 19 | 229 m | 26.3 | Indicative |
| Kilkenny | 104,160 | 50 | 2.74* | 18 | 236 m | 27.9 | Indicative |
| Monaghan | 65,288 | 50 | 2.74* | 18 | 236 m | 27.9 | Indicative |
| Longford | 46,751 | 43 | 2.71 | 16 | 254 m | 32.3 | Indicative |
| Offaly | 83,150 | 42 | 2.84 | 14 | 263 m | 34.5 | Indicative |
| Cavan | 81,704 | 42 | 2.80 | 15 | 261 m | 34.0 | Indicative |
| Tipperary | 167,895 | 39 | 2.67 | 14 | 264 m | 35.0 | Indicative |
| Sligo | 70,198 | 38 | 2.74* | 14 | 271 m | 36.8 | Indicative |
| Clare | 127,938 | 37 | 2.67 | 14 | 271 m | 36.8 | Indicative |
| Donegal | 167,084 | 34 | 2.66 | 12 | 283 m | 40.0 | Indicative |
| Kerry | 156,458 | 33 | 2.74* | 12 | 291 m | 42.4 | Indicative |
| Galway County | 194,281 | 30 | 2.81 | 10 | 309 m | 47.6 | Indicative |
| Roscommon | 70,259 | 28 | 2.74* | 10 | 316 m | 50.0 | Indicative |
| Mayo | 137,970 | 25 | 2.74* | 9 | 335 m | 56.2 | Indicative |
| Leitrim | 35,199 | 22 | 2.74* | 8 | 356 m | 63.3 | CSO |
| State average | 5,149,139 | 73 | 2.74 | 26 | 196 m | 19.2 | CSO |
CSO density published verbatim by CSO. Indicative density cross-referenced and not yet confirmed against CSO table F1013 — use for shaping, not for contractual sizing. * county average household size unavailable; national 2.74 applied. Cork City and Cork County are excluded from this ranking: the only published density for Cork sits on a land-area basis and is not comparable to the CSO water-inclusive figures used throughout.
03 · What density does to a rep-day
Geometry sets your cost per acquisition before anyone knocks.
Average distance between doors scales with the inverse square root of density. Quadruple the doors per km² and you halve the walk. That single relationship explains most of the productivity gap between an urban and a rural field team, and it is entirely predictable from census data.
The model below assumes a five-hour productive canvassing window, 2.5 minutes of fixed time per door (approach, knock, wait, conversation or no-answer) and a 5 km/h walking pace. It is illustrative — your own contact and conversion rates sit on top of it — but the shape holds.
| Area | Doors/km² | Walk between doors (min) |
Doors attempted per rep-day | Relative cost per door |
|---|---|---|---|---|
| Dublin City | 1,825 | 0.28 | 108 | 1.00× |
| Galway City | 623 | 0.48 | 101 | 1.07× |
| South Dublin | 446 | 0.57 | 98 | 1.10× |
| Fingal | 235 | 0.78 | 91 | 1.18× |
| Louth | 59 | 1.56 | 74 | 1.46× |
| Kildare | 52 | 1.66 | 72 | 1.50× |
| Meath | 30 | 2.17 | 64 | 1.68× |
| Wexford | 25 | 2.42 | 61 | 1.77× |
| Kilkenny | 18 | 2.84 | 56 | 1.92× |
| Donegal | 12 | 3.40 | 51 | 2.12× |
| Mayo | 9 | 4.02 | 46 | 2.35× |
| Leitrim | 8 | 4.27 | 44 | 2.43× |
Illustrative model. Doors attempted, not contacts made. Rural figures are optimistic: they exclude driveways, gates, and the drive time between clusters of houses, all of which worsen with distance.
Two things stand out. First, the productivity gap in attempted doors is roughly 2.4× between Dublin City and Leitrim — meaningful, but smaller than people expect, because fixed door-time dominates until spacing gets very wide. Second, and far more important, the territory gap is 230×. The same weekly door target that fits inside 0.3 km² in Dublin City needs 63 km² in Leitrim. That is not a canvassing problem, it is a routing, vehicle and supervision problem — and it is where rural D2D budgets actually break.
The practical rule
Below roughly 25 doors per km², pure walk-and-knock stops working and the model has to change: cluster on built-up areas, pre-book, or pair canvassing with a vehicle and a driver. Nineteen of the areas above sit below that line.
04 · Segmentation
Five kinds of Irish territory, and they need five different field models.
Dense urban core
Dublin City, Dún Laoghaire-Rathdown, Galway City. Walk-only territories measured in streets, not townlands. Apartment access and gatekeeping are the binding constraint, not distance. Highest private rental share in the country, so household turnover is fast and the switching window opens often. Supervision is easy; access is hard.
Suburban
South Dublin, Fingal. Estate-based canvassing: high door counts, predictable street geometry, larger households (3.02 average in Fingal), family decision-making. The best pound-for-pound territory in Ireland for most consumer D2D propositions.
Commuter belt
Louth, Kildare. Strong door density plus the fastest-ageing populations in the state — Kildare’s 65+ cohort grew 35 per cent since 2016 and Meath’s 30 per cent. Weekday daytime contact rates are suppressed by commuting, so evening and weekend shifts carry the campaign.
Regional town and hinterland
Wexford, Waterford, Carlow, Kilkenny, Westmeath, Limerick. County-level density is misleading here: the real market is a handful of built-up areas surrounded by land. Plan at town level, not county level, or the average will lie to you in both directions.
Dispersed rural
Leitrim, Mayo, Roscommon, Galway County, Kerry, Donegal. Walk-and-knock is not viable as a primary motion. These counties have the highest owner-occupied-outright shares in the state, the oldest populations and the highest home-presence rates — so contact rates are excellent once you arrive. The cost is entirely in getting there. Vehicle-based, cluster-routed, appointment-led.
05 · Who actually opens the door
Density decides how many doors you reach. Demography decides how many open.
Three census variables move contact rate and conversion more than anything else in a field campaign, and all three are published per county.
People aged 65 and over
776,315 people, 15.1 per cent of the population, and the fastest-growing cohort in every single county. Growth since 2016 runs from 18 per cent in Kerry to 35 per cent in Kildare and 30 per cent in Meath. This group has the highest daytime presence at home of any cohort, which makes daytime canvassing viable in territories where it otherwise would not be — and it makes conduct, pace and consent handling a compliance issue, not a soft skill.
Households of one person
425,974 people live alone — roughly 23 per cent of all occupied private households. Dublin City alone has 61,525, Cork 49,705, Donegal 16,436, Tipperary 15,933, Galway County 15,615. Operationally these are single-decision-maker doors: no deferral to an absent partner, shorter sales cycle, higher same-visit close rate. In a territory plan they are worth weighting up.
Recent movers
265,098 usual residents moved home in the year to April 2022, in 112,548 households — about one household in sixteen. Seventy-one per cent moved within the same county. A move is the moment every household utility, waste, broadband and subscription decision is reopened at once, which is why new-build and recently-turned-over streets convert far above territory average. Dublin City recorded 32,910 within-county moves. Roscommon and Leitrim have the highest out-of-county outflow, at 46 and 45 per cent of movers respectively — a churn signal for anyone selling a recurring service in those counties.
06 · Tenure and product fit
Who owns the door determines what you can sell through it.
Nationally, of 1,541,557 households with a stated tenure: 44.1 per cent own outright, 34.5 per cent own with a mortgage, and 21.4 per cent rent privately. The county spread is wide enough to change which proposition you deploy where.
| Area | Households (stated tenure) | Owned with mortgage |
Owned outright | Private rented | Field implication |
|---|---|---|---|---|---|
| Dublin (combined) | 428,200 | 34.7% | 36.1% | 29.2% | Highest rental share. Fast churn, short tenancies, permission-limited on anything structural. |
| Kildare | 71,237 | 45.3% | 37.4% | 17.3% | Most mortgaged county listed. Younger owner households, refinancing and home-improvement receptive. |
| Louth | 40,319 | 39.4% | 42.1% | 18.5% | Balanced. Broad proposition range works without splitting the script. |
| Cork (combined) | 177,136 | 33.4% | 45.4% | 21.2% | Mirrors the national mix closely — a reasonable pilot market. |
| Carlow | 17,946 | 33.4% | 46.7% | 20.0% | Owner-weighted with a real rental base in Carlow town. |
| Kilkenny | 30,903 | 35.0% | 49.9% | 15.0% | Half own outright. Longer cycle, higher trust threshold, higher lifetime value. |
| Roscommon | 22,808 | 30.0% | 54.3% | 15.6% | Thin rental market. Renter-targeted propositions have almost no addressable base. |
| Kerry | 49,037 | 26.9% | 56.0% | 17.1% | Two outright owners for every mortgage. Oldest, most settled, most decision-authorised doors. |
| National | 1,541,557 | 34.5% | 44.1% | 21.4% | — |
CSO Census 2022 Profile 2. Excludes local authority and voluntary/co-operative rented households, so shares are of stated private tenure rather than all households.
The practical read: solar, insulation, retrofit, alarms and anything fixed to the building belong in outright-owner territory — Kerry, Roscommon, Kilkenny, Carlow. Broadband, waste, energy switching, media subscriptions and insurance travel best in high-churn, high-rental territory — Dublin above all, then Cork and the regional cities. Deploying the wrong one into the wrong tenure profile produces a poor result that gets blamed on the channel.
07 · Data integrity
Four traps that will make your territory model wrong.
Most published Irish density figures are not comparable with each other. If you are building a commercial model on them, these four issues matter more than any analysis sitting on top.
1. Water-inclusive versus land-only area
CSO areas include water bodies. Third-party sites frequently do not. Dublin City is 4,618 persons/km² on the CSO basis and roughly 5,032 on a land-only basis — a 9 per cent difference in the same city. Both are defensible. Mixing them is not. Every figure in this report uses the CSO water-inclusive basis. If your field product needs true land-only door density, recompute all 31 rows from a single land-area source and label it as such.
2. De facto versus usually resident population
Wexford is 163,919 people on the de facto (present on census night) measure and 163,527 usually resident. Neither is wrong; they count different things. This report is de facto throughout, matching the CSO Summary Results and county press statements.
3. The Cork boundary change
The 2019 boundary extension moved roughly 85,000 people from Cork County into Cork City. Any 2016–2022 comparison for either area individually is invalid. Only the combined Cork total of 584,156 is like-for-like, and CSO itself frames comparisons at county-of-Cork level. Cork is footnoted or suppressed in every change calculation we publish.
4. Two national household totals
Occupied households appear as 1,841,152 in the Summary Results and 1,836,728 in Profile 2. The gap is 4,424 households, or 0.24 per cent — immaterial at county scale, material in a contract. This report uses the Profile 2 figure and states so.
What is not yet CSO-confirmed in this report
CSO publishes area and density verbatim for five entries only: Dublin City (4,618), Dún Laoghaire-Rathdown (1,848), Galway City (1,665), Leitrim (22) and the State (73). Every other density here is cross-referenced and marked Indicative. Closing that gap takes two downloads — CSO PxStat tables F1013 (population density and area by county and city) and FY004B (household size) — and we will not present indicative figures as CSO-official until they are pulled. The ranking and the tiering are unaffected; the decimal places are.
08 · Applying it
How we turn this into a territory plan.
This is the sequence we run before a single rep is deployed on a client campaign, and it is the same sequence whether the market is Irish counties or English districts.
- Fix one area basis and write it on every page. Water-inclusive or land-only, de facto or usually resident. Decide once, apply to all rows, disclose it. Most territory disputes are basis disputes.
- Convert population to doors. Occupied private households, not people, not addresses, not postcodes. Use county household size, not the national average, wherever it is published.
- Tier the market by doors per km² and assign a field model per tier — walk-only, estate-based, evening-weighted, cluster-routed or appointment-led. One national model applied to five different geographies is how D2D campaigns lose money.
- Overlay the demographics that move contact rate — 65+ share for daytime viability, one-person households for decision speed, recent movers for switching windows.
- Filter by tenure for proposition fit before assigning territories, not after the first disappointing week.
- Drop to town level below 25 doors per km². County averages describe rural counties badly. Built-up area statistics, not county totals, are the planning unit once density falls.
- Set rep targets from geometry, not from the best territory. A 60-door day in Mayo is a better performance than a 100-door day in Dublin City. Targets that ignore this punish your rural teams for their postcode.
Territory intelligence
GoSales Solutions maps a market before we knock: door density, demographic overlay and tenure fit, county by county, agreed with the client before deployment.
Planning a field campaign in Ireland or the UK? We will build the territory model first.
Method and sources
All population, household size, age, tenure and migration figures are from the Central Statistics Office, Census of Population 2022 (Summary Results, Profile 1 and Profile 2, and county press statements). Population is the de facto measure throughout. Density is the CSO published figure, inclusive of water bodies. Doors per km² is a derived metric: population density × 0.98 ÷ average household size, where 0.98 is the national share of population in private households. Door spacing is the square-lattice equivalent, 1 ÷ √density. Rep-day figures are an illustrative model with assumptions stated in section 03 and are not observed field results. Densities marked indicative are not CSO-published and are pending confirmation against CSO PxStat table F1013.
Licence
Contains Irish Public Sector Data (Central Statistics Office, Census of Population 2022) licensed under a Creative Commons Attribution 4.0 International (CC BY 4.0) licence.
Author
Shivani Seth is GTM Strategy & Revenue Growth Manager at GoSales Solutions, working on territory intelligence, revenue operations and field sales analytics. This is part of an ongoing series applying census data to field sales territory design across Ireland and the UK.